How Much Electricity Does A NAS Use and How Much Does it Cost to run 24×7?
Energy AIN’T Cheap! If you have been keeping an eye on your electricity bill recently, you will have noticed that the amount you are paying per kilowatt has steadily increased month after month for several years now. Because of any one of about a hundred different global factors (local conflict, slow renewable energy uptake, monopolizing energy companies with powerful lobbying – take your pick!) most of us in 2022/2023 have seen increases in energy costs. In this energy-aware climate, it can be appreciated that a NAS drive (a 24×7 appliance) seemingly has its cost to the end user in terms of electricity as something of a vague number. With so many kinds of NAS available in the market, featuring a mix of CPUs, PSUs, Bays and utilities, PLUS the wide range of HDD/SSD drives in the market to choose from – there are just so many variables when trying to work out how much power your NAS drive is using and how much that is translating to in your monthly energy bill! So, today’s article is about working out how much electricity the popular Synology DS920+ NAS and four WD Red Plus 4TB HDDs will consume, as well as how much that equals to you in £, $ or € per day, month and year! We tested the popular 2020 generation desktop 4-Bay NAS system, connected them to an energy monitor and worked out how much power they used in full active use and in idle. Let’s begin.
|
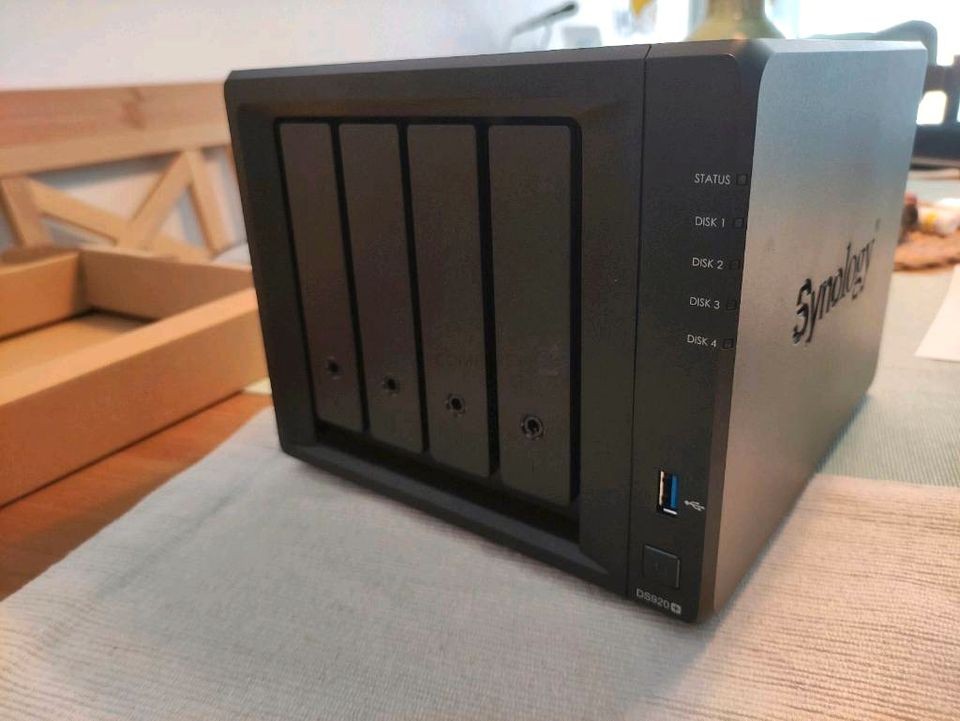
The Synology DS920+ NAS
Current Price/Availability on Amazon –$550+
|
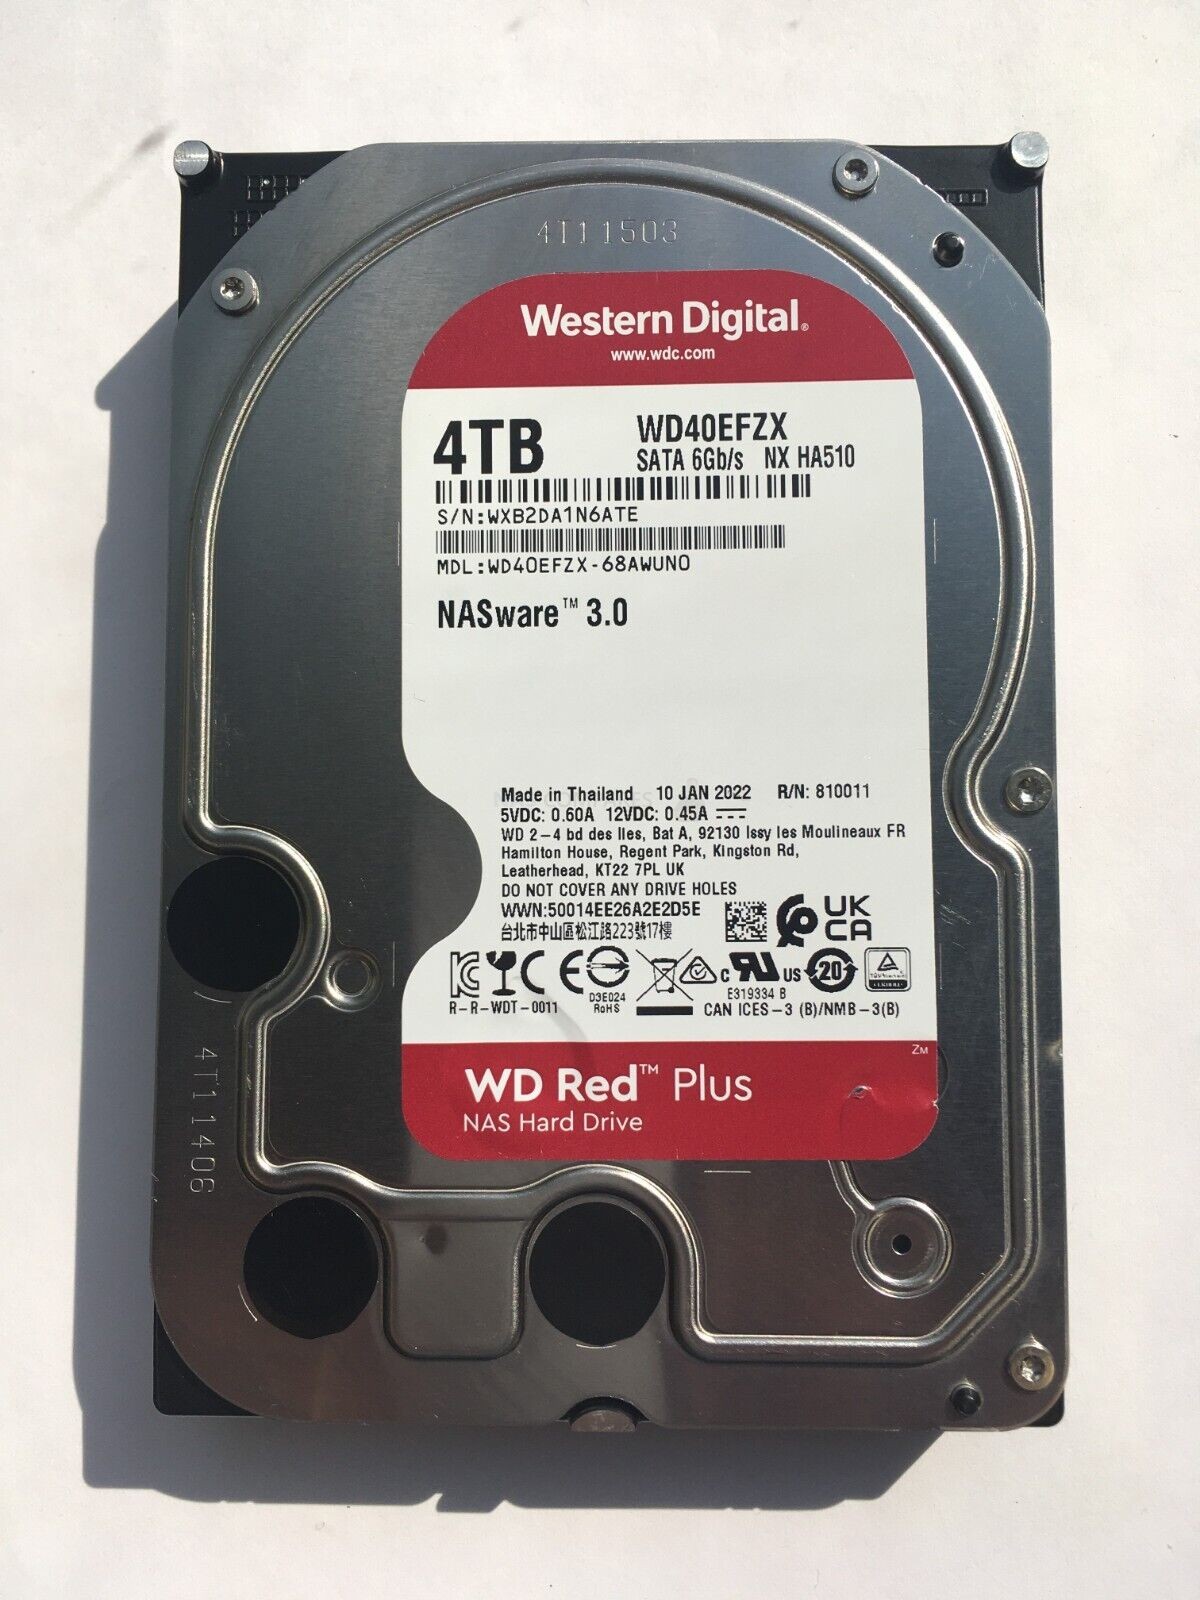
The WD Red Plus 4TB HDD (x4)
Current Price/Availability on Amazon –$79
|
 |
 |
|
Intel J4125 CPU, 4-Core 2.0-2.7Ghz Celeron CPU
4GB 2666Mhz non-ECC Memory, 1GbE |
4 Terabyte Capacity – SATA 3.5″ Form Factor
5400RPM – 128MB Cache – 4x 1TB Platters
|


NAS Power Use Test Setup
Choosing the appropriate NAS drive for these tests was always going to be tough. I DO intend on repeating these tests with several different NAS drives after this in some follow-up articles (the larger article that I will be adding to can be found HERE), but wanted these first few tests to be focused on one of the most POPULAR NAS setups (and the DS920+ is still one of the most popular Synology NAS the brand has ever produced and the WD Red 4TB HDD has been popular for around a DECADE), as well as identifying the difference between using newer gen CPUs and Larger drives vs using older generation devices and smaller capacity media. This will involve 2x tests on each NAS+Media configuration. Here is a breakdown of the hardware configurations and test architectures:
- Synology DS920+ NAS, Default Celeron+4GB Memory Setup over 1GbE
- 4x WD Red WD40EFZX 4TB (Synology Test in SHR – 1st party fluid equivalent to RAID5)
- During ‘ACTIVE’ 24hr Tests, the NAS was prevented from going into standby/idle. 1 VM running, 1-Core and 1GB Memory, 2x IP Cameras recording non-stop, drive S.M.A.R.T tests scheduled to be hourly
- During IDLE 24hr Tests, the VM was deleted, VM and Surveillance Software disabled, ALL S.M.A.R.T tests disabled and network cable (1GbE) disconnected.
- The first day of operation (which includes initialization and RAID creation) not counted (but visible at the start of the graph).
- Power was monitored with a GOSUND SMART KIT Smart Plug, Mini 13A – Find HERE
The initial 24 hours (used for system initialization and RAID configuration) were NOT included in the power usage monitoring, as although they appear on the graph they are one-off single-event scenarios. Each test (Active vs Idle) was conducted for 24hrs and the overall electricity usage was displayed in kw (kilowatt). But what is the difference between Active and Idle activity? Why does it matter?
What is the Difference Between a NAS Drive ‘Active’ and in ‘IDLE / Standby’?

Although a NAS is designed to be in operation 24×7 and is consuming electricity when running, the actual reality of this and the extent to which it is consuming it is actually alot more nuanced. Most home users who have a NAS system will use the NAS directly for a significant;y smaller portion of time per day than it is actually powered on for. Perhaps to stream a movie or a couple of TV episodes, run a daily backup, have a couple of cameras in/outside their home that are sending recordings (or more likely just alerts and associated captures) to the NAS and that is about it. They will periodically do more than these, maybe a VM, more sophisticated backup or use some of the other services ad hoc, but the result is that in most domestic/bog standard home scenarios, a NAS will be switched internally to Idle/Standby after no pro-active use quite quickly and spend 80-90% of the time in low power modes. Business users might well be using the system 24×7 for sync’d tasks and on-going camera recording, but even then, this will be a lower % of system resources in use. So, in order to find a comparable and relative means to study the electricity use of a NAS and it’s cost, I have conducted two tests per NAS+HDD configuration. The first, a 24 Hour Active test, with the system using a decent % of it’s CPU+Memory, a swell as the HDDs not being given the chance to switch to Idle/Standy (by constantly writing AND performing S.M.A.R.T tests hourly). The idle tests involve all of those apps, services and scheduled operations being cancelled and the network cable being disconnected from the NAS (for another 24hrs). From here we can work out the cost of an hour of power usage by either setup in high activity and near-zero activity. But how can we work out the COST of the electricity used by the NAS in that time period?
How Energy Costs in these NAS Tests were Calculated?
The results of the energy usage are then cross-referenced by ‘sust-it.net’ and calculations of the cost of the used electricity per day, month and year was calculated for the UK, U.S, Germany, Australia and Canada. Now, using a select energy tariff is much harder, as there are quite literally thousands of different energy providers globally, each with their own pricing on the cost of energy per ‘kWh’. So, I used the national average calculations that were provided by ‘sust-it’ for each of those areas. Some are clearly more up-to-date than others (i.e the United Kingdom Avg Energy cost tariff is dated October 2022, whereas the Canada’s average energy cost is from way back in March 2020), however, these will still provide a good basis for understanding what a NAS drive is going to cost you in electricity when it is in operation. The national tariff averages used in this article for each region are as follows:
UK: Energy Price (October 2022) electricity rate of 34.00 pence per kWh.
USA: Average (Feb 2022) electricity rate of 14.80 cents per kWh.
Germany: Average (June 2021) electricity rate of 31.93 Eurocents per kWh.
Australia: Average (March 2022) electricity rate of 23.59 cents per kWh.
Canada: Average (2020) electricity rate of 8.50 cents per kWh.
Source – https://www.sust-it.net
There are the rates that we will be using to calculate the running costs of the Synology NAS system (and more importantly its WD Drive setup and CPU usage).
Test – Synology DS920+ NAS and 4X 4TB WD Red Drives
I set the Synology DS920+ NAS and WD Red 4TB Hard drives up in the following configuration for the Active tests:
- Synology DS920+ NAS PSU = 100W External PSU, Intel Celeron J4125 Quad Core 2.0-2.7Ghz, 4GB DDR4 2666Mhz Memory
- WD Red Plus 4TB HDD, SHR
- Surveillance Station 9 and 2x Reolink Dome IP Cameras (24hrs Active)
- Synology Virtual Machine Manager, 1x Windows VM, 1 Core, 1GB Memory (24hrs Active)
- Synology Storage Manager (DSM 7.1) and S.M.A.R.T Tests per Hour (24hr Active)
- Reported Average power requirements of a WD Red Plus 4TB (Single):
- Read/Write: 4.7
- Idle: 3.1
- Standby Sleep: 0.3
Then, 24hrs later, I disabled all these processes, disconnected the RJ45 LAN and let the NAS fall into idle/standby mode. The results were as follows:
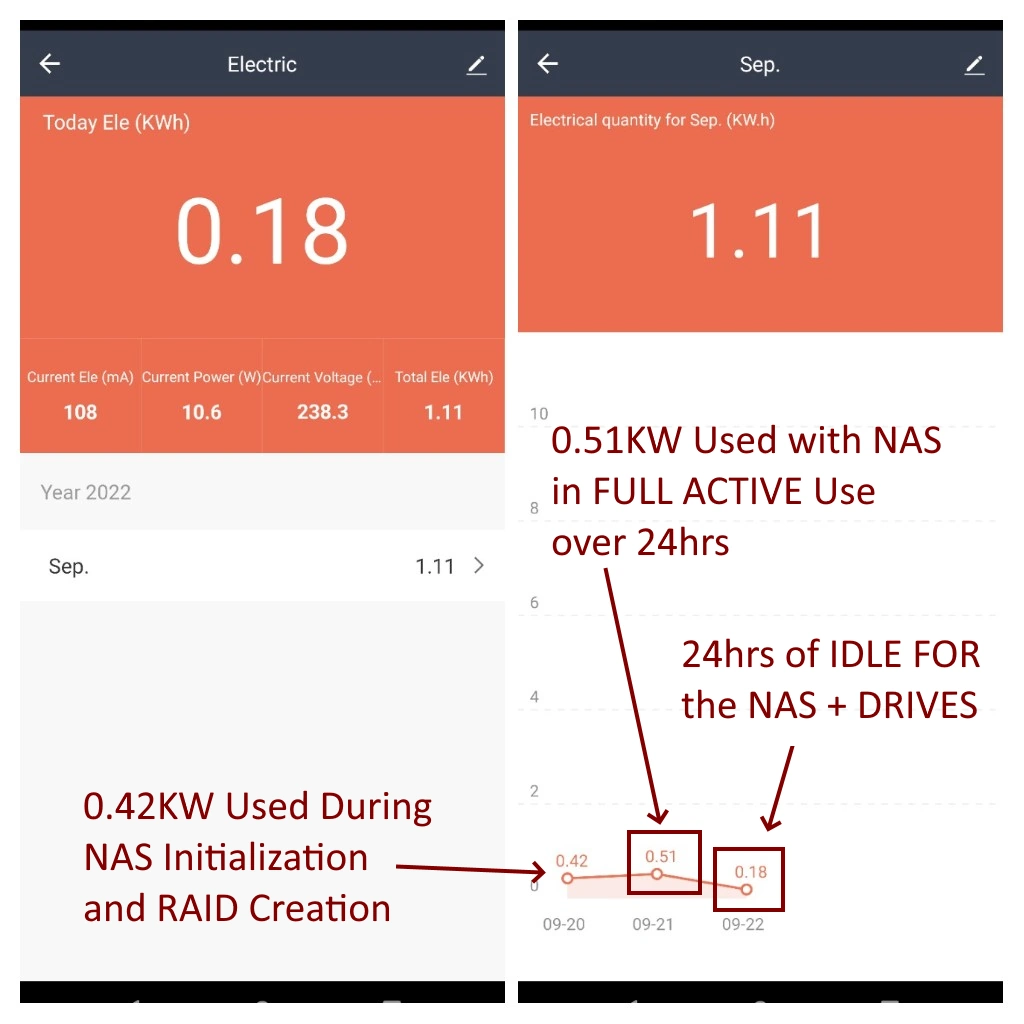

The 0.42kW that was used in the initialization of both the NAS and the drives in the RAID was NOT included in the respective Actie/Idle tests. The 24 hours of Active use energy consumption was 0.51KW
Synology DS920+ and WD Red Plus 4TB HDD Test Results:
0.51KW divided by 24 (hours) = 0.02125kW use per Hour
| 24hr Active Use (0.51KW) | UK Power Use | U.S Power Use | Germany Power Use | Australia | Canada |
| Cost Per Day | £0.1734 | $0.0755 | €0.1628 | AU$0.1203 | CA$0.0433 |
| Cost per Month | £5.27 | $2.29 | €4.95 | AU$3.65 | CA$1.31 |
| Cost Per Year | £63.29 | $27.55 | €59.42 | AU$43.90 | CA$15.80 |
0.18KW divided by 24 (hours) = 0.0075kW use per Hour
| 24hr Idle Use (0.18KW) | UK Power Use | U.S Power Use | Germany Power Use | Australia | Canada |
| Cost Per Day | £0.0612 | $0.0266 | €0.0575 | AU$0.0425 | CA$0.0153 |
| Cost per Month | £1.86 | $0.80 | €1.74 | AU$1.29 | CA$0.46 |
| Cost Per Year | £22.33 | $9.70 | €20.98 | AU$15.51 | CA$5.58 |
So, what about if you were to only use the NAS at active use for around 25% of the day (i.e 6hrs of active with backups, multimedia, etc) and 75% of the day as idle (i.e 18hrs unused):
25%/75% Active/Idle Use:
| 6hr Active Use / 18hr Idle | UK Power Use | U.S Power Use | Germany Power Use | Australia | Canada |
| Cost Per Day | £0.08925 | $0.0387 | €0.0838 | AU$0.0618 | CA$0.0222 |
| Cost per Month | £2.7146 | $1.1786 | €2.5496 | AU$1.882 | CA$0.6775 |
| Cost Per Year | £32.57 | $14.14 | €30.59 | AU$22.58 | CA$8.13 |
Now it is worth keeping in mind that the costs for each region have a notably different price per kW rate, so even after factoring in currency conversions between different units (eg Pounds vs Dollars), there is a significant degree of difference in the costs per day, month and year of the exact same NAS+HDD setup above. The idle power use was just 35.29% of the power use of the active testing in the same 24hr time block. I will be conducting more tests with more NAS configurations in the coming months and either adding them to this article, or creating their own articles. Stay tuned, check below to see if other NAS power tests have been published and recommended to you, or watch the video version of these tests (which goes into more detail on the current predicaments in the energy crisis facing many of us in 2022, 2023 and beyond.

📧 SUBSCRIBE TO OUR NEWSLETTER 🔔
🔒 Join Inner Circle
Get an alert every time something gets added to this specific article!
This description contains links to Amazon. These links will take you to some of the products mentioned in today's content. As an Amazon Associate, I earn from qualifying purchases. Visit the NASCompares Deal Finder to find the best place to buy this device in your region, based on Service, Support and Reputation - Just Search for your NAS Drive in the Box Below
Need Advice on Data Storage from an Expert?
Finally, for free advice about your setup, just leave a message in the comments below here at NASCompares.com and we will get back to you.


 |
 |