How Much Electricity Does A Synology DS1621+ NAS Use and How Much Does it Cost to run 24×7?
“The Bigger the NAS, the BIGGER the electricity bill!” – THAT was what a fellow visitor of a trade show I attended back in 2019 said to me as I waxed lyrical about the hardware of a new Xeon Powered Synology solution that was being previewed at the time. I have never really forgotten about that. Not only because (at least, at the time) I thought that it was rather cynical, but also because, sadly, he was absolutely correct. As different NAS servers arrive, with bigger and better CPUs, greater and great bay numbers and larger and larger chassis – the more power they will end up consuming when in operation 24×7. Even in Standby/Idle, they are still acting away at your mains powers and ultimately adding small 0.0001s to your energy bill. Right now, in this energy-aware climate, it can be appreciated that a NAS drive (a 24×7 appliance) seemingly has its cost to the end user in terms of electricity as something of a vague number. With so many kinds of NAS available in the market, featuring a mix of CPUs, PSUs, Bays and utilities, PLUS the wide range of HDD/SSD drives in the market to choose from – there are just so many variables when trying to work out how much power your NAS drive is using and how much that is translating to in your monthly energy bill! So, today’s article is about working out how much electricity the popular Synology DS1621+ NAS and four WD Ultrastar 10TB HDDs will consume, as well as how much that equals to you in £, $ or € per day, month and year! We tested the popular 2020 generation desktop 6-Bay NAS system, connected them to an energy monitor and worked out how much power they used in full active use and in idle. Let’s begin.
|
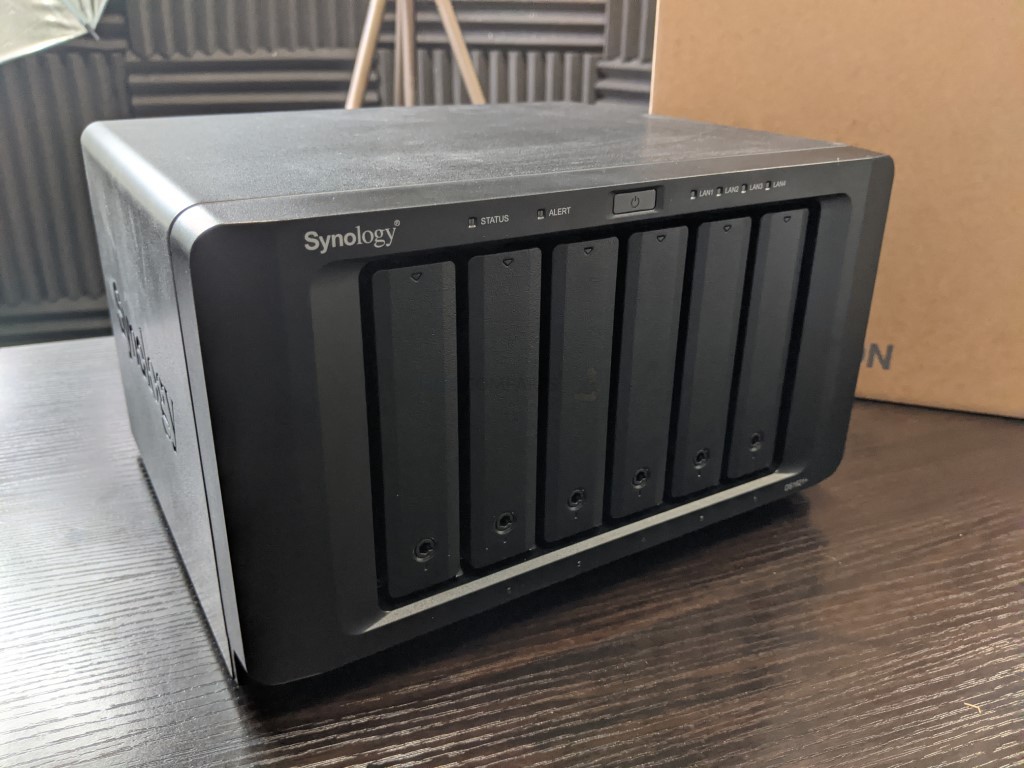
The Synology DS1621+ NAS
Current Price/Availability on Amazon –$999+
|
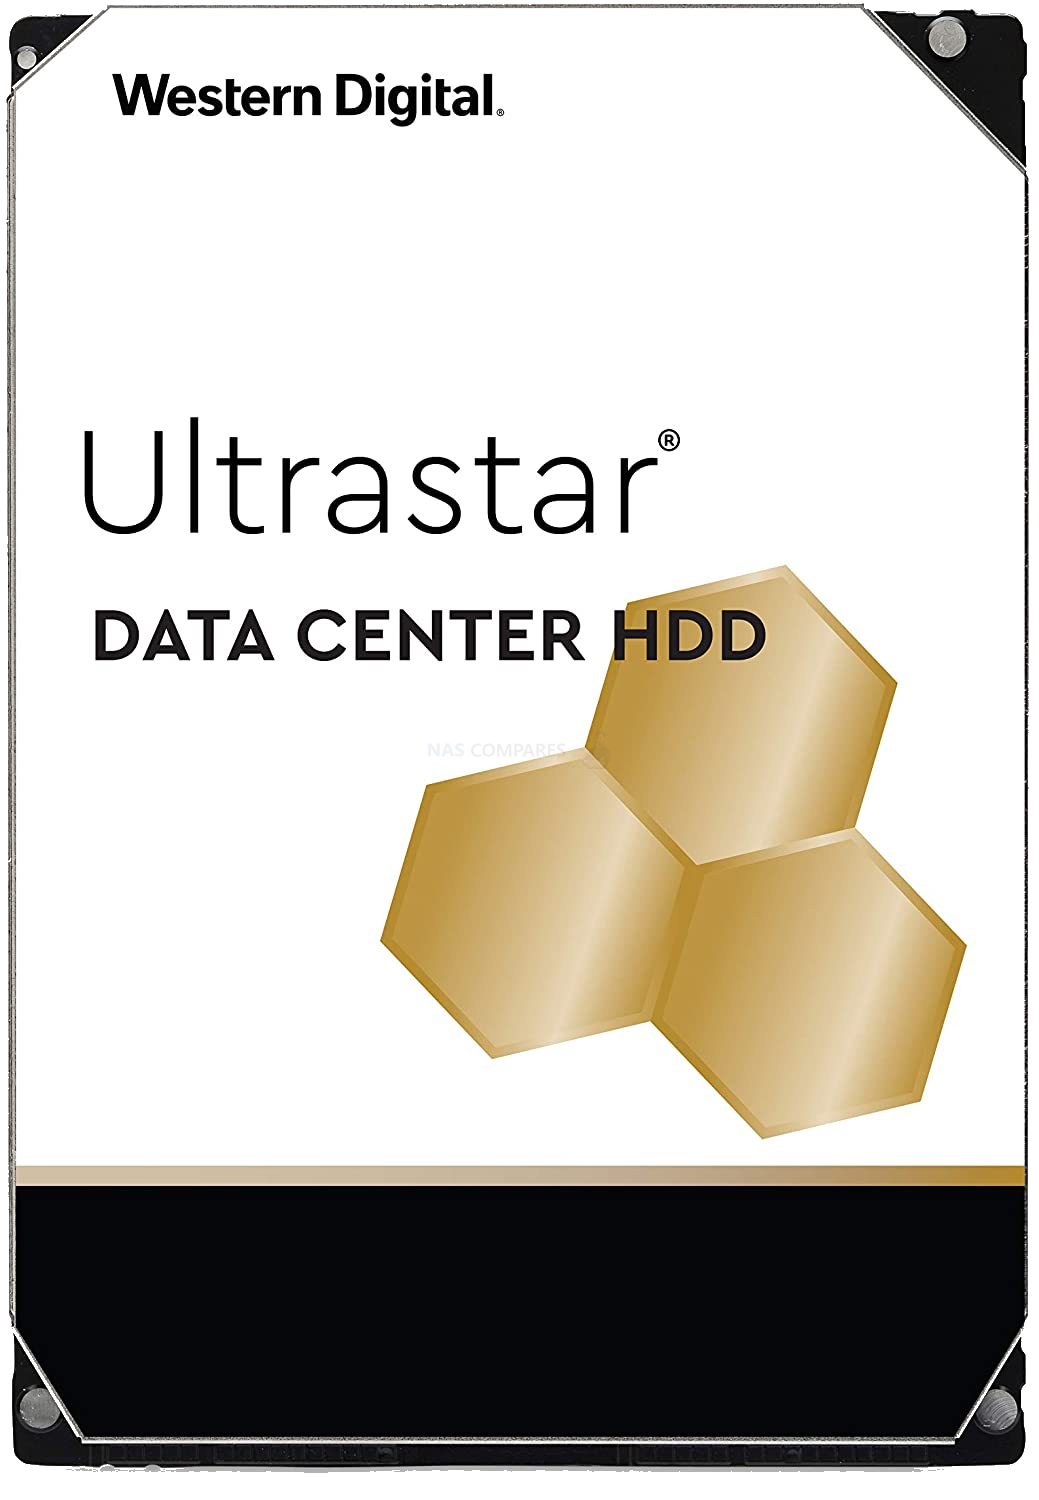
The WD Ultrastar 10TB HDD (x5)
Current Price/Availability on Amazon –$259
|
 |
 |
|
AMD Ryzen V1500B CPU, 4-Core 2.2hz Celeron CPU
4GB 2400Mhz ECC Memory, 1GbE |
10 Terabyte Capacity – SATA 3.5″ Form Factor
7200RPM – 256MB Cache – 6x Platters
|
NAS Power Use Test Setup
Choosing the appropriate NAS drive for these tests was always going to be tough. I DO intend on repeating these tests with several different NAS drives after this in some follow-up articles (the larger article that I will be adding to can be found HERE), but wanted these first few tests to be focused on one of the most POPULAR NAS setups (and the DS1621+ is still one of the most popular Synology NAS the brand has ever produced and the WD Ultrastar 10TB HDD has been popular for around a 4 years), as well as identifying the difference between using newer gen CPUs and Larger drives vs using older generation devices and smaller capacity media. This will involve 2x tests on each NAS+Media configuration. Here is a breakdown of the hardware configurations and test architectures:
- Synology DS1621+ NAS, AMD CPU+4GB Memory Setup over 1GbE
- 5x WD Ultrastar 10TB (RAID5)
- During ‘ACTIVE’ 24hr Tests, the NAS was prevented from going into standby/idle. 1 VM running, 1-Core and 1GB Memory, 2x IP Cameras recording non-stop, drive S.M.A.R.T tests scheduled to be hourly
- During IDLE 24hr Tests, the VM was deleted, VM and Surveillance Software disabled, ALL S.M.A.R.T tests disabled and network cable (1GbE) disconnected.
- The first day of operation (which includes initialization and RAID creation) not counted (but visible at the start of the graph).
- Power was monitored with a GOSUND SMART KIT Smart Plug, Mini 13A – Find HERE
The initial 24 hours (used for system initialization and RAID configuration) were NOT included in the power usage monitoring, as although they appear on the graph they are one-off single-event scenarios. Each test (Active vs Idle) was conducted for 24hrs and the overall electricity usage was displayed in kw (kilowatt). But what is the difference between Active and Idle activity? Why does it matter?
What is the Difference Between a NAS Drive ‘Active’ and in ‘IDLE / Standby’?
Although a NAS is designed to be in operation 24×7 and is consuming electricity when running, the actual reality of this and the extent to which it is consuming it is actually alot more nuanced. Most home users who have a NAS system will use the NAS directly for a significant;y smaller portion of time per day than it is actually powered on for. Perhaps to stream a movie or a couple of TV episodes, run a daily backup, have a couple of cameras in/outside their home that are sending recordings (or more likely just alerts and associated captures) to the NAS and that is about it. They will periodically do more than these, maybe a VM, more sophisticated backup or use some of the other services ad hoc, but the result is that in most domestic/bog standard home scenarios, a NAS will be switched internally to Idle/Standby after no pro-active use quite quickly and spend 80-90% of the time in low power modes. Business users might well be using the system 24×7 for sync’d tasks and on-going camera recording, but even then, this will be a lower % of system resources in use. So, in order to find a comparable and relative means to study the electricity use of a NAS and it’s cost, I have conducted two tests per NAS+HDD configuration. The first, a 24 Hour Active test, with the system using a decent % of it’s CPU+Memory, a swell as the HDDs not being given the chance to switch to Idle/Standy (by constantly writing AND performing S.M.A.R.T tests hourly). The idle tests involve all of those apps, services and scheduled operations being cancelled and the network cable being disconnected from the NAS (for another 24hrs). From here we can work out the cost of an hour of power usage by either setup in high activity and near-zero activity. But how can we work out the COST of the electricity used by the NAS in that time period?
How Energy Costs in these NAS Tests were Calculated?
The results of the energy usage are then cross-referenced by ‘sust-it.net’ and calculations of the cost of the used electricity per day, month and year was calculated for the UK, U.S, Germany, Australia and Canada. Now, using a select energy tariff is much harder, as there are quite literally thousands of different energy providers globally, each with their own pricing on the cost of energy per ‘kWh’. So, I used the national average calculations that were provided by ‘sust-it’ for each of those areas. Some are clearly more up-to-date than others (i.e the United Kingdom Avg Energy cost tariff is dated October 2022, whereas the Canada’s average energy cost is from way back in March 2020), however, these will still provide a good basis for understanding what a NAS drive is going to cost you in electricity when it is in operation. The national tariff averages used in this article for each region are as follows:
UK: Energy Price (October 2022) electricity rate of 34.00 pence per kWh.
USA: Average (Feb 2022) electricity rate of 14.80 cents per kWh.
Germany: Average (June 2021) electricity rate of 31.93 Eurocents per kWh.
Australia: Average (March 2022) electricity rate of 23.59 cents per kWh.
Canada: Average (2020) electricity rate of 8.50 cents per kWh.
Source – https://www.sust-it.net
There are the rates that we will be using to calculate the running costs of the Synology NAS system (and more importantly its Drive setup and CPU usage).
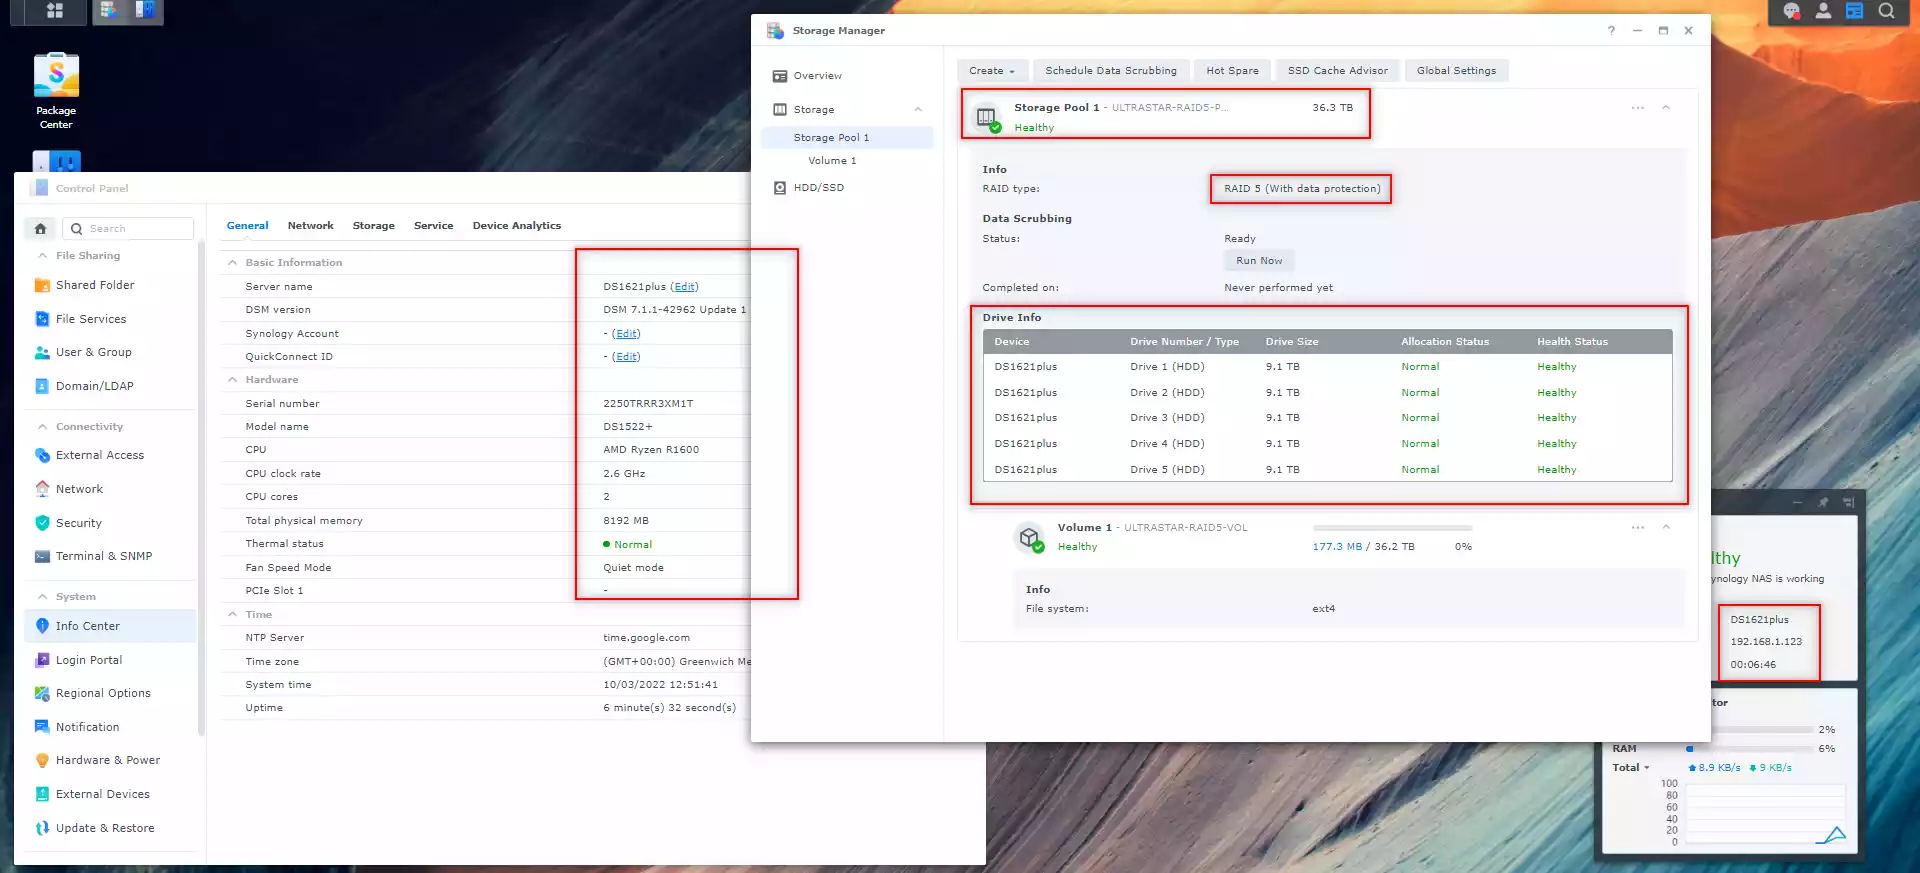
Test – Synology DS1621+ NAS and 5x WD Ultrastar 10TB Drives
I set the Synology DS1621+ NAS and WD Ultrastar 4TB Hard drives up in the following configuration for the Active tests:
- Synology DS1621+ NAS PSU = 100W External PSU, Intel Celeron J4125 Quad Core 2.0-2.7Ghz, 4GB DDR4 2666Mhz Memory
- WD Ultrastar 10TB HDD, SHR
- Surveillance Station 9 and 2x Reolink Dome IP Cameras (24hrs Active)
- Synology Virtual Machine Manager, 1x Windows VM, 1 Core, 1GB Memory (24hrs Active)
- Synology Storage Manager (DSM 7.1) and S.M.A.R.T Tests per Hour (24hr Active)
- Reported Average power requirements of a WD Ultrastar 10TB (Single):
- 9.2W Active
- 8.0W Idle
Then, 24hrs later, I disabled all these processes, disconnected the RJ45 LAN and let the NAS fall into idle/standby mode. The results were as follows:
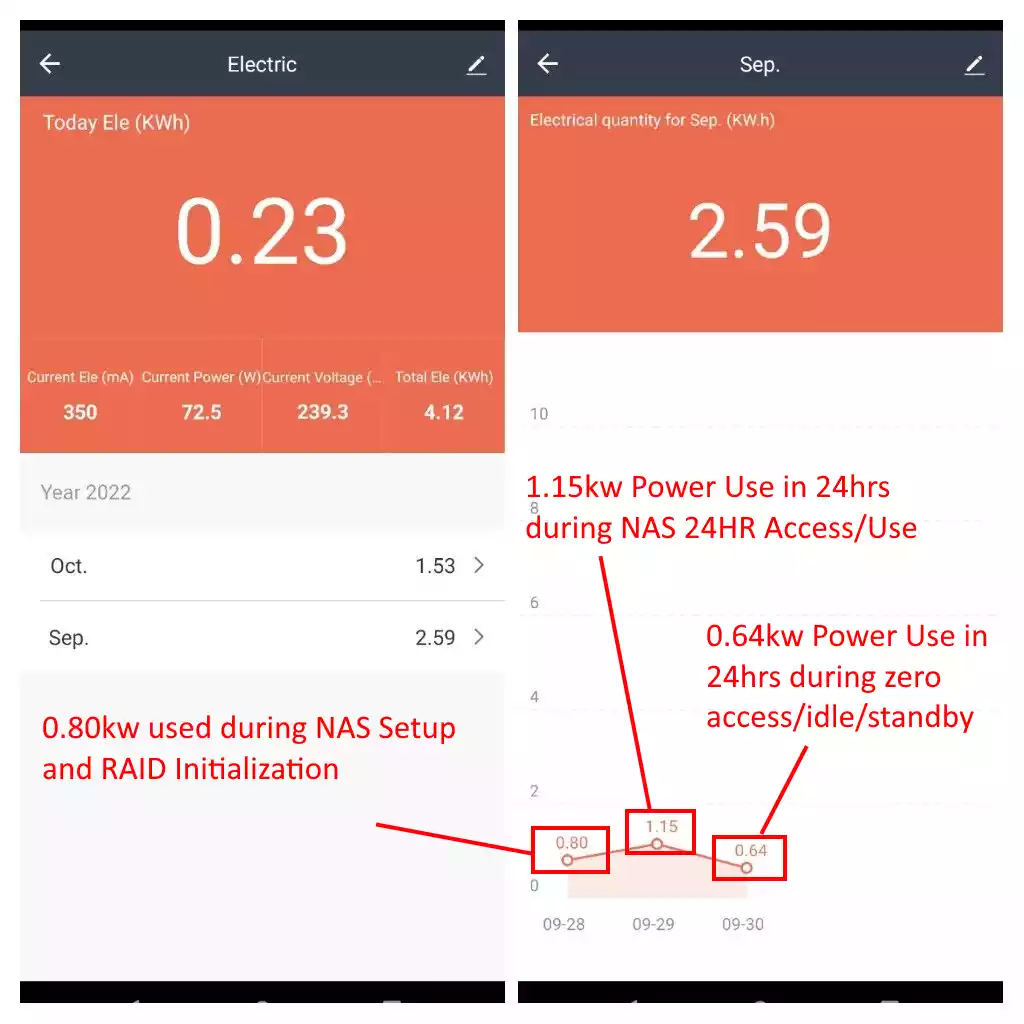
The 0.80kW that was used in the initialization of both the NAS and the drives in the RAID was NOT included in the respective Actie/Idle tests.
Synology DS1621+ and WD Ultrastar 10TB HDD Test Results:
0.0479kW use per hour active and 0.0266kW use per hour idle =
| 1hr Active Use (KW) | UK Power Use £ | U.S Power Use $ | Germany Power Use € | Australia AU$ | Canada CA$ |
| Per Hour | 0.016 | 0.007 | 0.015 | 0.011 | 0.004 |
| 1hr Idle Use (KW) | UK Power Use | U.S Power Use | Germany Power Use | Australia | Canada |
| Per Hour | £0.01 | 0.003 | 0.008 | 0.006 | 0.002 |
1.15KW over 24 hours Active =
| 24hr Active Use (KW) | UK Power Use £ | U.S Power Use $ | Germany Power Use € | Australia AU$ | Canada CA$ |
| Cost Per Day | £0.38 | 0.168 | 0.36 | 0.264 | 0.096 |
| Cost per Month | 11.68 | 5.11 | 10.95 | 8.03 | 2.92 |
| Cost Per Year | 140.16 | 61.32 | 131.4 | 96.36 | 35.04 |
0.64KW over 24 hours idle =
| 24hr Idle Use (KW) | UK Power Use £ | U.S Power Use $ | Germany Power Use € | Australia AU$ | Canada CA$ |
| Cost Per Day | £0.22 | 0.072 | 0.192 | 0.144 | 0.048 |
| Cost per Month | 6.57 | 2.19 | 5.84 | 4.38 | 1.46 |
| Cost Per Year | 78.84 | 26.28 | 70.08 | 52.56 | 17.52 |
So, what about if you were to only use the NAS at active use for around 25% of the day (i.e 6hrs of active with backups, multimedia, etc) and 75% of the day as idle (i.e 18hrs unused):
25%/75% Active/Idle Use:
| 6hr Active Use / 18hr Idle | UK Power Use £ | U.S Power Use $ | Germany Power Use € | Australia AU$ | Canada CA$ |
| Cost Per Day | £0.26 | 0.096 | 0.234 | 0.174 | 0.06 |
| Cost per Month | 7.8475 | 2.92 | 7.1175 | 5.2925 | 1.825 |
| Cost Per Year | 94.17 | 35.04 | 85.41 | 63.51 | 21.9 |
Now it is worth keeping in mind that the costs for each region have a notably different price per kW rate, so even after factoring in currency conversions between different units (eg Pounds vs Dollars), there is a significant degree of difference in the costs per day, month and year of the exact same NAS+HDD setup above. Stay tuned, check below to see if other NAS power tests have been published and recommended to you, or watch the video version of these tests (which goes into more detail on the current predicaments in the energy crisis facing many of us in 2022, 2023 and beyond.
📧 SUBSCRIBE TO OUR NEWSLETTER 🔔
🔒 Join Inner Circle
Get an alert every time something gets added to this specific article!
This description contains links to Amazon. These links will take you to some of the products mentioned in today's content. As an Amazon Associate, I earn from qualifying purchases. Visit the NASCompares Deal Finder to find the best place to buy this device in your region, based on Service, Support and Reputation - Just Search for your NAS Drive in the Box Below
Need Advice on Data Storage from an Expert?
Finally, for free advice about your setup, just leave a message in the comments below here at NASCompares.com and we will get back to you. Need Help?
Where possible (and where appropriate) please provide as much information about your requirements, as then I can arrange the best answer and solution to your needs. Do not worry about your e-mail address being required, it will NOT be used in a mailing list and will NOT be used in any way other than to respond to your enquiry.

|
 |
WHY IS PLEX A BIT S#!t NOW? IS 2026 JELLYFIN TIME? (RAID Room)
Synology FS200T NAS is STILL COMING... But... WHY?
Gl.iNet vs UniFi Travel Routers - Which Should You Buy?
UnifyDrive UP6 Mobile NAS Review
UniFi Travel Router Tests - Aeroplane Sharing, WiFi Portals, Power Draw, Heat and More
UGREEN iDX6011 Pro NAS Review
Access content via Patreon or KO-FI
Discover more from NAS Compares
Subscribe to get the latest posts sent to your email.




Very useful information.Thanks it’s just what I was looking for!
REPLY ON YOUTUBE
It would actually be cheaper to pay apple 8.99 a month then tbf ????
REPLY ON YOUTUBE
What UPS with a shut down software would u recommend for DS1621+ ?
REPLY ON YOUTUBE
Way too much information. Do a summary video and talk about how to reduce power consumption. Ssd vs HDD. Adding a 10gbe card. Processor power states. Does it ever actually hibernate the drives. Fan state. Swapping the fans for another brand. Nvme choices etc. Use a power meter which graphs per minute, e.g. tplink p110.
Great subject btw!
REPLY ON YOUTUBE
Very niche, indeed. Still, exceptionally useful to those who need it. Thank you!
REPLY ON YOUTUBE
I have a Synology 1821+, it is equipped with eight Seagate 8 TB hard drives, when the device is idle, it consumes 56 W, when a spin up occurs it is approximately 110 W, and when it is in use, it is 106 W. I just thought I’d forward that information to you, I have a power monitoring device. This also includes a UPS. Sometime I’ll have to check it out without the UPS to see what its power consumption is
REPLY ON YOUTUBE
Hi, thanks for this video. Great channel. I have a question regarding daily usage of this NAS. I often turn it on and off when it is needed. I use it while working on my projects. Can this in any way harm it over longer period of time when it is constantly switched on and of ? Mostly once or twice a day. I do it exactly because of unnecesary power consumption and noise. Or maybe NAS should be rather swiched on most of the time? Thanks again.
REPLY ON YOUTUBE
Very cool! Turns out that Australia electricity costs went up substantially since that site’s info. But a very worthy consideration.
REPLY ON YOUTUBE
Would be interesting to have such test with only ssd drives
REPLY ON YOUTUBE
LMAO the true cost of your example NAS is closer to *$640 PER YEAR!* .. You’re forgetting a whole lot of big numbers here!!! A NAS (e.g. cost $2,500; ) is good for at most 5 years, and for reliability it should be replaced. The hardware replacement alone will cost you $500 per year. On top of that, you need a good quality UPS at $50 per year plus a $100 every 2-3 years battery replacement, $40 battery cost per year. Electricity cost average in the US is about $50 per year. So $500 + $50 +$40 + $50 = $640/year
REPLY ON YOUTUBE
Great video. As always, thanks for including Canada. Incidentally, the majority of electricity, in Ontario, comes from nuclear. The runner-up is provided by hydroelectric means, i.e., massive dams with turbines. Also, holy haircut, Batman! ????
REPLY ON YOUTUBE
Thus is exactly what I was looking for. Thanks!
REPLY ON YOUTUBE
To me videos like this are very interesting, especially in this time with the energy prices. I hope you can make a video about the DS1621xs+ power consumption.
REPLY ON YOUTUBE
@NASCompares can you please make a video about Asustor as6704t with Jellyfin and how to use Intel Quick Sync
REPLY ON YOUTUBE
I guess the figures for DS1821+ would be similar?
REPLY ON YOUTUBE
Interesting article but the electric bill has to be paid.
Thanks
REPLY ON YOUTUBE
Thanks for the video. I found it useful. As you said, “niche of a niche,” but that’s what we come to your channel for.
I think it would be cool if you did a couple of things to expand on this content and the usefulness of the resources you’ve created.
1.) Same NAS, different drives.
It’s interesting to talk about how different drives impact electricity consumption, but without testing, which keeps all other variables the same (as possible) i’s just informed speculation. Controlled measured data trumps informed speculation, IMO. Testing different drives in different NAS devices makes the data less relatable, and therefore a bit less useful, IMO.
Likewise, for the number of drives. I’d like to see the same nas with 4, 6, 8, of the same drive, and a NAS with 4 larger drives versus 8 smaller drives (of the same make and line) which amount to the same storage capacity. It’d be interesting to see, versus speculate, which is more cost effective in a particular NAS at a particular storage capacity, a greater number of more efficient (lower capacity) drives, or a smaller number of less efficient (higher capacity) drives.
2.) Calculators on your website.
These could be thrown together fairly simply. They could be used to estimate the running costs of various NAS devices (with various electricity costs), but also with use mix ratios and various drives and drive configurations. Over time, as you do more testing, the data pool could expand, and the estimates improved.
It’d be neat to be able to visit your calculators, plug in a bit of data, and then be able to compare various NAS devices and drive configurations with the expected power consumption and power costs in those configurations.
REPLY ON YOUTUBE
Thanks for the video ! 🙂
wow! I didn’t realise a NAS would consume so much money here in the UK! I know it will vary depending on what the NAS is being used for but it is a considerable amount – Google Drive might be more economical at this point … especially as not only do you have to consider the running cost, but the purchase of the system. which is £1,000+ (920+ or 923+ (still not decided yet :/ , plus drives)
REPLY ON YOUTUBE
I just wish you would get the units correct. You keep mixing kW and kWh. If a nas uses 1.15 kW during a 24 hour period it means it uses 27.6 kWh during a 24 hour period. If on the other hand what you meant is that during the 24 hour period it had consumed 1.15 kWh, that translates to a consumption of roughly 47.9W. I know the unit of kWh is basicly stupid as it is kilo Joules per second times 3600 seconds.
REPLY ON YOUTUBE
Chia paying $30 mounthds
REPLY ON YOUTUBE
You’re utility bills are going up because of us here in “‘murica” The little games we’ve been playing with our fascist corporatist capitalist empire is costing the world a lot of money in increased energy prices. Sorry we did that to you all. It’s gonna get worse so hang in there but maybe someday, someone will put us in our place.
REPLY ON YOUTUBE
If i run 700VA UPS+ NAS ..how much extra watt in 24 hours ?
still dont understand about UPS power comsumption
REPLY ON YOUTUBE
All right! my drives!
REPLY ON YOUTUBE
Great and helpful analysis. I now need to calculate the cost of a running a power cable to Canada. Thank you.
REPLY ON YOUTUBE
I really like your topics, but i never watch your videos, because all of them are audio and video out of sync, and my brain almost exlodes when watching this. Hope you can fix this. Testet on several devices.
REPLY ON YOUTUBE
Quite interesting. Reduces my guilt about my homemade nas with a n3050 Atom running 24/7. Thanks!
REPLY ON YOUTUBE
What NAS is it realy?
On the screenshot it is a DS1522+
On the technical data in the article it has an intel celeron cpu?
regards peter
Synology DS1621+